-
Latest Version
Wireshark 4.6.5 (64-bit) LATEST
-
Review by
-
Operating System
Windows 8 (64-bit) / Windows 10 (64-bit) / Windows 11
-
User Rating
Click to vote -
Author / Product
-
Filename
Wireshark-4.6.5-x64.exe
An open-source network protocol analyzer that lets you capture and interactively browse the traffic running on a computer network.
Originally named Ethereal, it was rebranded as Wireshark in 2006 and has since become a go-to tool for network troubleshooting, analysis, software and communication protocol development, and education. It's available for Windows, macOS, Linux, and other Unix-like operating systems.
The app was written by networking experts around the world and is an example of the power of open-source. Wireshark 64-bit is used by network professionals around the world for analysis, troubleshooting, software and protocol development, and education.
The program has all of the standard features you would expect in a protocol analyzer, and several features not seen in any other product. Its open source license allows talented experts in the networking community to add enhancements.
Highlights
- Deep inspection of hundreds of protocols, with more being added all the time
- Live capture and offline analysis
- Standard three-pane packet browser
- Multi-platform: Runs on Windows, Linux, macOS, Solaris, FreeBSD, NetBSD, and many others
- Captured network data can be browsed via a GUI, or via the TTY-mode TShark utility
- The most powerful display filters in the industry
- Rich VoIP analysis
- Read/write many different capture file formats: tcpdump (libpcap), Pcap NG, Catapult DCT2000, Cisco Secure IDS iplog, Microsoft Network Monitor, Network General Sniffer® (compressed and uncompressed), Sniffer® Pro, and NetXray®, Network Instruments Observer, NetScreen snoop, Novell LANalyzer, RADCOM WAN/LAN Analyzer, Shomiti/Finisar Surveyor, Tektronix K12xx, Visual Networks Visual UpTime, WildPackets EtherPeek/TokenPeek/AiroPeek, and many others
- Capture files compressed with gzip can be decompressed on the fly
- Live data can be read from Ethernet, IEEE 802.11, PPP/HDLC, ATM, Bluetooth, USB, Token Ring, Frame Relay, FDDI, and others (depending on your platform)
- Decryption support for many protocols, including IPsec, ISAKMP, Kerberos, SNMPv3, SSL/TLS, WEP, and WPA/WPA2
- Coloring rules can be applied to the packet list for quick, intuitive analysis
- Output can be exported to XML, PostScript®, CSV, or plain text
- Packet Analysis: It captures data packets from a network in real-time or from saved capture files for in-depth analysis.
- Deep Inspection: Users can inspect hundreds of protocols, including Ethernet, IP, TCP, HTTP, DNS, and more, to diagnose network issues or investigate security incidents.
- Filtering: Advanced filtering capabilities allow users to sift through large volumes of data to focus on specific packets or protocols.
- Protocol Decoding: The app decodes packet contents into human-readable formats, aiding in understanding network communication.
- VoIP Analysis: Support for VoIP protocols enables analysis of voice and video communications.
- Exporting: Captured data can be exported to various file formats for further analysis or sharing.
- Extensibility: It offers a rich ecosystem of plugins and scripts for extending functionality.
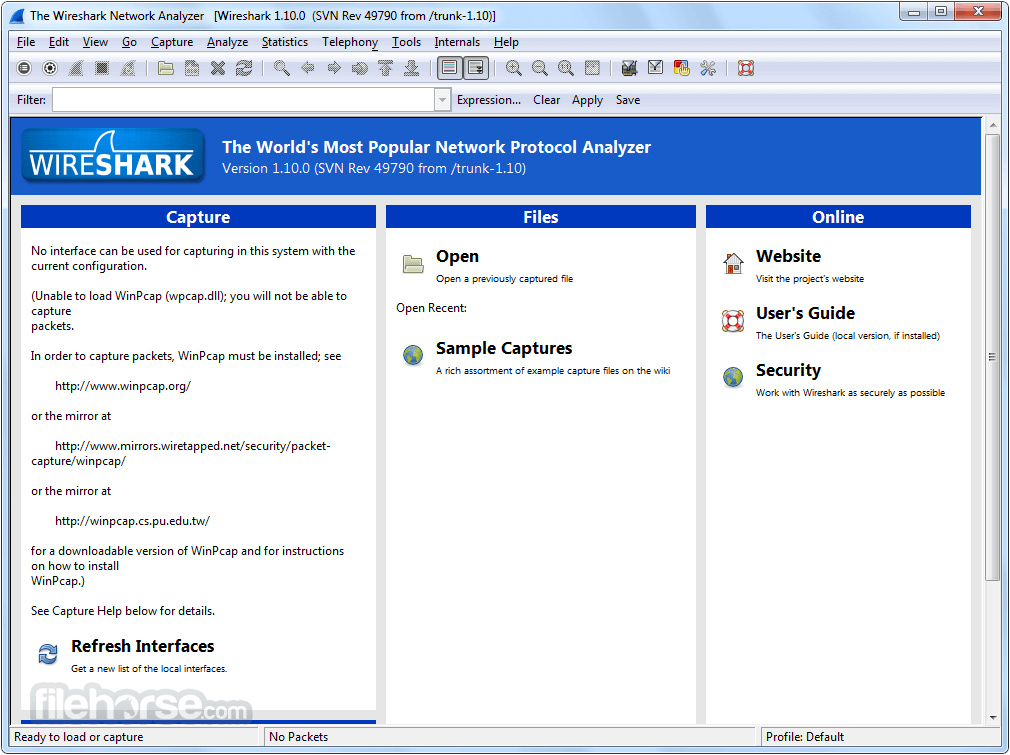
It features a comprehensive graphical user interface (GUI) with multiple panes for packet display, packet details, packet list, and more. It provides color-coded packet highlighting for easy identification of various protocols and types of traffic.
Installation and Setup
Installing this program is straightforward on most platforms. Users can download the installer from the official website or FileHorse and follow the on-screen instructions. On Windows, it also offers an option to install WinPcap or Npcap for packet capture.
How to Use
- Launch the tool and select the network interface for capturing packets.
- Start capturing packets by clicking the "Start" button.
- Analyze captured packets in real-time or from saved capture files.
- Apply filters to focus on specific packets or protocols.
- Use built-in tools for deep packet inspection, protocol decoding, and analysis.
- Export relevant data for further investigation or reporting.
Can Wireshark 64bit capture encrypted traffic?
It can capture encrypted traffic, but it cannot decrypt it unless the user has access to the encryption keys.
Does Wireshark support wireless network capture?
Yes, it supports capturing packets from wireless networks, but it requires compatible hardware and drivers.
Is Wireshark legal to use?
Yes, the software is legal to use for network analysis and troubleshooting. However, using it for unauthorized interception of network traffic may be illegal in some jurisdictions.
Can Wireshark be used for cybersecurity purposes?
Yes, the program is commonly used by cybersecurity professionals for analyzing network traffic, detecting anomalies, and investigating security incidents.
What are some common troubleshooting scenarios where Wireshark is useful?
It can help troubleshoot network connectivity issues, performance problems, security breaches, and application communication errors, among others.
Pricing
Thge tool is open-source and available for FREE under the GNU General Public License.
System Requirements
The program is available for Windows, macOS, Linux, and other Unix-like operating systems. System requirements vary depending on the platform and usage scenario but generally include a reasonable amount of RAM and disk space for packet capture and analysis.
PROS
- Comprehensive protocol support
- Extensive filtering and analysis capabilities
- Open-source and free
- Active community and ongoing development
- Cross-platform compatibility
- Steep learning curve for beginners
- Requires understanding of networking concepts
- Limited support for decrypting encrypted traffic
- Resource-intensive for capturing and analyzing large data volumes
What's new in this version:
Fixed:
- This release fixes quite a few vulnerabilities. This is due to to a recent trend in AI-assisted vulnerability reports.
- wnpa-sec-2026-08 Monero dissector crash
- wnpa-sec-2026-09 BT-DHT dissector crash
- wnpa-sec-2026-10 FC-SWILS dissector crash
- wnpa-sec-2026-11 SMB2 dissector infinite loop
- wnpa-sec-2026-12 ICMPv6 dissector crash
- wnpa-sec-2026-13 AFP dissector crash
- wnpa-sec-2026-14 TLS dissector crash and possible code execution
- wnpa-sec-2026-15 K12 RF5 file parser crash
- wnpa-sec-2026-16 SBC codec crash and possible code execution
- wnpa-sec-2026-17 RDP dissector crash and possible code execution
- wnpa-sec-2026-18 AMR-NB codec crash
- wnpa-sec-2026-19 SDP dissector crash
- wnpa-sec-2026-20 iLBC audio codec crash
- wnpa-sec-2026-21 Profile import crash and possible code execution
- wnpa-sec-2026-22 DCP-ETSI protocol dissector crash
- wnpa-sec-2026-23 BEEP protocol dissector crash
- wnpa-sec-2026-24 ZigBee protocol dissector crash
- wnpa-sec-2026-25 DLMS/COSEM protcol dissector infinite loop
- wnpa-sec-2026-26 Dissection engine zlib decompression crash
- wnpa-sec-2026-27 USB HID protocol dissector infinite loop
- wnpa-sec-2026-28 Dissection engine LZ77 decompression crash
- wnpa-sec-2026-29 Kismet protocol dissector crash
- wnpa-sec-2026-30 SANE protocol dissector infinite loop
- wnpa-sec-2026-31 DCP-ETSI protocol dissector crash
- wnpa-sec-2026-32 iLBC audio codec crash
- wnpa-sec-2026-33 TLS dissector infinite loop
- wnpa-sec-2026-34 ASN.1 PER protocol dissector crash
- wnpa-sec-2026-35 RTSP protocol dissector crash
- wnpa-sec-2026-36 IEEE 802.11 protocol dissector crash
- wnpa-sec-2026-37 MySQL protocol dissector crash
- wnpa-sec-2026-38 GNW protocol dissector infinite loop
- wnpa-sec-2026-39 OpenFlow v5 protocol dissector infinite loops
- wnpa-sec-2026-40 OpenFlow v6 protocol dissector infinite loop
- wnpa-sec-2026-41 MBIM dissector infinite loop
- wnpa-sec-2026-42 RPKI-Router protocol dissector infinite loop
- wnpa-sec-2026-43 GSM RP protocol dissector crash
- wnpa-sec-2026-44 WebSocket protocol dissector crash
- wnpa-sec-2026-45 SMB2 protocol dissector crash
- wnpa-sec-2026-46 HTTP protocol dissector crash
- wnpa-sec-2026-47 Sharkd utility memory leak
- wnpa-sec-2026-48 Sharkd utility crash
- wnpa-sec-2026-49 Sharkd utility crash
- wnpa-sec-2026-50 UDS protocol dissector infinite loop
The following bugs have been fixed:
- WSUG: Enabled Protocols dialog needs an update
- Build failure with Qt 6.11 beta
- BLF: Missing 4 byte alignment makes BLF files incompatible with Vector’s tools
- SMB2 decryption keys in smb2_seskey_list are not loaded on restart
- Fuzz job issue: fuzz-2026-03-01-13307044520.pcap
- Window with a message for ssh_strict_fopen
- IEEE 1722.1 Dissector for Stream Input Counters displays FRAMES_RX as "Stream Packets TX" Issue 21055.
- Wireshark 4.6.4 crashes
- Compilation error with Lua-5.5
- BSOD issue affecting Npcap 1.86
- Adding descriptions to BLF interfaces broke the Capture File Properties view
- Assertion Failure in ws_buffer_remove_start via Malformed Packet Manipulation
- Modbus/RTU fails to decode broadcast frames
- Lua not included unless CMake version >= 3.25
- sshdump: Regression in v4.6.4 – Failed to resolve hostname aliases from .ssh/config on Windows
- Fuzz job crash: fuzz-2026-03-25-13637733472.pcap
- dumpcap TCP@ section-header parsing remote heap corruption
- Netflix BBLog EVENT parsing crash
- On Windows, the Follow Stream feature output is shown in proportional font after zooming
- RTP Streams dialog Time of Day inconsistent behavior
- Sysdig Event Block Integer Underflow
- RF4CE NWK Dissector Heap Buffer Overflow (crash/OOB) Issue 21150.
- NetXray/Sniffer Padding Integer Underflow
- HTTP/2 ALTSVC/PRIORITY_UPDATE Frame Length Truncation (24-bit to 16-bit) Issue 21155.
- Snort config parser 2 buffer overflows
- ESP NULL Encryption Integer Underflow triggers Heap Overflow
- Heap buffer overflow in ISO 8583 dissector bin2hex() Issue 21171.
- wslua: NULL pointer dereference in get_dissector when passing an invalid GUID string to an FT_GUID table
- Fuzz job UTF-8 encoding issue: fuzz-2026-04-16-13947406035.pcap
- Qt: Waterfall bars misisng in conversation overview when "limit to display filter" is active
- text2pcap: heap-buffer-overflow in memmove when -P"dissector" payload exceeds reserved space
- text2pcap : Stack overflow via unbounded "g_alloca" in regex "seqno" Issue 21209.
- editcap: --novlan integer underflow in sll_remove_vlan_info causes denial of service on short SLL captures
- NAS-5GS - Mapping issue between IEI 0x7B and "S-NSSAI location validity information" IE
- RTP-MIDI dissector reports incorrect value for MTC Quarter Frame data
New and Updated Features:
- The Windows installers now ship with Npcap 1.87. They previously shipped with Npcap 1.86.
- The Windows installers now ship with Qt 6.10.3. They previously shipped with Qt 6.9.3.
Updated Protocol Support:
- AFP, AIN, ANSI_TCAP, ASAM CMP, ATN-ULCS, BEEP, BGP, BT HCI, BT HCI ISO, BT-DHT, CAMEL, ChargingASE, CMIP, COSEM, DAP, Darwin, DCP ETSI, DECT NR+, DISP, DMX, DNS, E1AP, E2AP, F1AP, FC-SWILS, Frame, FTAM, GLOW, GNW, GOOSE, GPRSCDR, GSM MAP, GSM RP, H.225.0, H.245, H.248, H.450, H.450.ROS, HNBAP, HTTP, HTTP2, ICMPv6, IDMP, IEEE 1609.2, IEEE 1722.1, IEEE 802.11, INAP, IPsec, IPv4, IPv6, ISAKMP, ISO 8583, ITS, JSON 3GPP, Kismet, LCSAP, LDAP, LPPa, M2AP, M3AP, MAS-5GS, MBIM, MMS, Modbus, Monero, MySQL, NBAP, NGAP, NRPPa, OpenFlow 1.4, OpenFlow 1.5, OpenVPN, P1, P22, P7, PCAP, Q932.ROS, QSIG, QUIC, RANAP, RCv3, RF4CE, RF4CE Profile, RNSAP, RPKI-Router, RRLP, RTPS, RUA, S1AP, SABP, SANE, SBcAP, SDP, SGP.22, Signal PDU, SMB2, SSH, T.38, TDSUDP, UDS, WebSocket, X2AP, X509CE, X509IF, X509SAT, XnAP, Z39.50, and ZBD
New and Updated Capture File Support:
- 3gpp phone log, Android Logcat Binary, Android Logcat Text, Ascend, BLF, CAM Inspector, Catapult DCT2000, Cinco NetXray/Sniffer, CoSine IPSX L2, DBS Etherwatch, EyeSDN, HP-UX nettl, IBM iSeries, Ixia IxVeriWave, K12, Micropross mplog, MPEG2 transport stream, NetScaler, NetScreen, pcapng, pppd log, Sniffer, Systemd Journal, TCPIPtrace, Toshiba Compact ISDN Router, and Visual Networks
Plugin Development Changes:
- On UN*X systems (excluding macOS when running from an app bundle, as with the official installer) extcap binaries are now searched for under the libexec directory by default, e.g., /usr/libexec/wireshark/extcap instead of /usr/lib64/wireshark/extcap or similar. This is the customary place for helper binaries, which as opposed to libraries do not need multiarch support. The location can be overridden via the environment variable WIRESHARK_EXTCAP_DIR. The extcap binaries shipped with Wireshark are installed in the new location, but third party extcaps may need packaging changes. This change was effective in version 4.6.0, but was not explicitly noted in the release notes previously. Note that some distributions do not use a libexec directory, such as Alpine Linux, which does not have multilib support. On such systems extcap binaries should be in the same location as before.
 OperaOpera 131.0 Build 5877.5 (64-bit)
 Kling AIKling AI - Text or Image to Video
 PhotoshopAdobe Photoshop CC 2026 27.5 (64-bit)
 BlueStacks AIBlueStacks AI
 OKXOKX - Buy Bitcoin or Ethereum
 CapCutCapCut 8.5.0
 PC RepairPC Repair Tool 2026
 Hero WarsHero Wars - Online Action Game
 TradingViewTradingView - Trusted by 100 Million Traders
 AdGuard VPNAdGuard VPN 2.9.0


Comments and User Reviews